Mechanical Engineer Salary in Peoria, IL: $132,468 (2026)
Quick Answer:A full-time mechanical engineer in Peoria, IL earns a median $132,468/year (≈ $63.69/hour) in nominal terms for 2026 — projected from BLS OEWS 2025 (SOC 17-2141). Once you factor in Peoria's price level (9% below national, BEA RPP 91.2), that paycheck buys what $145,201 would nationally. Nominal pay sits 28.1% above the Illinois state average.
Official BLS data · View source
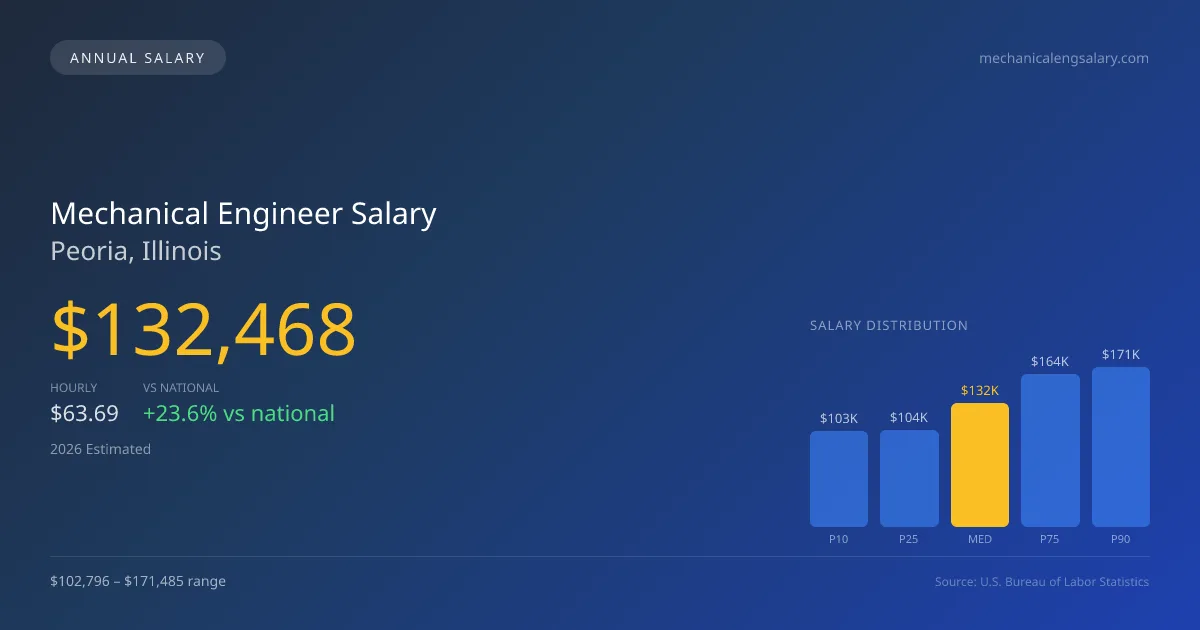
In 2026, mechanical engineers in Peoria, Illinois, command an impressive median annual salary of $132,468, significantly higher than the national median of $107,150. The salary range spans from $102,796 at the 10th percentile to $171,485 at the 90th percentile, highlighting a competitive pay scale within the local market. This robust compensation reflects the region's focus on diverse sectors such as aerospace firms, notably SpaceX and Boeing, as well as the automotive industry, including electric vehicle manufacturers like Tesla. This strong salary structure can be attributed to Peoria's unique position where cutting-edge industries intersect, influencing the demand and compensation for mechanical engineers.
Salary Breakdown
| Percentile | Annual | Hourly |
|---|---|---|
| Entry Level (P10) | $102,796 | $49.42 |
| Lower Range (P25) | $103,640 | $49.82 |
| Median (P50)(typical) | $132,468 | $63.69 |
| Upper Range (P75) | $164,229 | $78.96 |
| Top Earners (P90) | $171,485 | $82.45 |
Median Salary Position
23.63% above the national average
2026 Salary Percentile Distribution in Peoria
In Peoria, IL, the mechanical engineer salary spread from the 10th to 90th percentile is $68,689 (2026 est.). At $132,468, the local median is 23.63% above the national median of $107,150.
Salary Calculator
At 40 hours/week in Peoria: You'd be in the lower-middle range
How Peoria Mechanical Engineer Pay Compares
Peoria median: $132,468/year (2026)
| Compared To | Median Salary | Peoria Pays |
|---|---|---|
| Illinois Average | $103,410 | +28.10% more |
| National Average | $107,150 | +23.63% more |
Mechanical Engineers in Peoria, IL earn a median of $132,468 per year (2026 est.), which is 23.63% higher than the national median of $107,150 and 28.10% above the Illinois state average of $103,410.
Cost-of-Living Adjusted Salary
Peoria has a cost of living 8.77% below the national average, meaning your salary goes further here.
Adjusted salary = nominal × (100 / CoL index). CoL index: 100 = national average.
Peoria, IL has a cost-of-living index of 91.231 (below the national average of 100). A mechanical engineer earning $132,468 nominally has purchasing power equivalent to $145,201 in an average-cost city — an effective 9.61% boost.
Compare Purchasing Power
Select a city to see how your salary compares after cost of living
Select a city above to compare purchasing power
2019 BLS Actual
$109,325
2025 BLS Actual
$128,710
2026 Current Est.
$132,468
2019–2027 Growth
+24.7%
Salary Trajectory for Mechanical Engineers in Peoria (2019–2027)
2019–2025: actual BLS OEWS data for this metro area. 2026+: CAGR 2.92% projection.
| Year | Annual Salary | Status |
|---|---|---|
| 2019 | $109,325 | Actual |
| 2020 | $111,464 | Actual |
| 2021 | $120,700 | Actual |
| 2022 | $104,570 | Actual |
| 2023 | $110,080 | Actual |
| 2024 | $115,350 | Actual |
| 2025 | $128,710 | Actual |
| 2026(current) | $132,468 | Estimated |
| 2027 | $136,336 | Projected |
Based on 7 years of BLS OEWS data for the Peoria metropolitan area, the median mechanical engineer salary grew 17.7% from $109,325 (2019) to $128,710 (2025). At a 2.92% compound annual growth rate, salaries are projected to reach $136,336 by 2027 — a total increase of $27,011 (24.71%) from 2019.
Note: Historical values (2019–2025) are actual BLS OEWS figures for the Peoria metropolitan area, sourced from annual Occupational Employment and Wage Statistics surveys. 2026–2026 figures are current estimates, and 2027 values are projections, calculated using a 2.92% CAGR derived from 7-year BLS historical data. Actual salaries may vary based on employer, experience, certifications, and local market conditions.
Salary by Experience Level
| Experience | Estimated Salary Range |
|---|---|
| 0-2 years (New Graduate) | $102,796 – $103,640 |
| 3-5 years (Mid Career) | $103,640 – $132,468 |
| 5+ years (Experienced) | $132,468 – $164,229 |
| 10+ years (Top Earner) | $164,229 – $171,485 |
ME, PE salary ranges estimated from BLS percentile data. Individual mechanical engineer compensation varies by employer, certifications, and specialization.
Mechanical Engineer Job Market in Peoria
The job market in Peoria supports approximately 2,120 mechanical engineers, creating a solid foundation for professionals seeking opportunities in the region. With a cost of living index of 91.231, the purchasing power for engineers is favorable, enhancing the attractiveness of the mechanical engineer pay in Peoria, IL. Major employers such as Caterpillar in heavy equipment and Boeing in aerospace often provide salaries on the higher end, driven by industry demands and specialized skills. The salary variability can be influenced by factors including the type of engineering discipline, such as the increasing need for security clearances in defense-related roles and the potential for equity compensation in tech-adjacent firms. For engineers aiming to maximize their earnings, pursuing licensure as a Professional Engineer (PE) or advancing into management positions can be effective strategies tailored to Peoria's job environment.
More salary data for Peoria, IL:
Frequently Asked Questions
How much do mechanical engineers make in Peoria, IL in 2026?
Is Peoria, IL a good place to work as a mechanical engineer?
Can mechanical engineers make $100K in Peoria?
What is the cost-of-living adjusted mechanical engineer salary in Peoria?
How much does a mechanical engineer make per hour in Peoria?
Related Pages
Compare Salaries
Career Resources
Nearby Cities in Illinois
Written by Amina Patel, PE
Career Analyst
Amina has 10 years of experience in mechanical engineering. She specializes in thermal analysis and works in the automotive industry.
Methodology & Data Source
Salary figures on this page are 2026 projections based on the Bureau of Labor Statistics Occupational Employment and Wage Statistics (OEWS) survey, May 2026 release. The BLS reported a median annual salary of $128,710 for mechanical engineersin the Peoria metropolitan area. A 2.92% compound annual growth rate (CAGR), calculated from 6-year national BLS wage trends, was applied to project current 2026 compensation. Percentile ranges (P10–P90) represent the full salary distribution across experience levels and practice settings in this market.
Data Sources & Methodology
Source: BLS, OEWS, 5-year dataset (–). Per-city data from annual BLS metropolitan area surveys.
2026 figures are projected from 2025 BLS data using a compound annual growth rate (CAGR) of 2.92%, derived from historical BLS wage trends for mechanical engineers (SOC 17-2141).
Compiled and verified by Amina Patel, PE, a licensed mechanical engineer with 10+ years of clinical experience. · View source data at BLS.gov