Mechanical Engineer Salary in Lancaster, PA: $86,154 (2026)
Quick Answer:A full-time mechanical engineer in Lancaster, PA earns a median $86,154/year (≈ $41.43/hour) in nominal terms for 2026 — projected from BLS OEWS 2025 (SOC 17-2141). Once you factor in Lancaster's price level (2% below national, BEA RPP 98.3), that paycheck buys what $87,682 would nationally. Nominal pay sits 11.1% below the Pennsylvania state average.
Official BLS data · View source
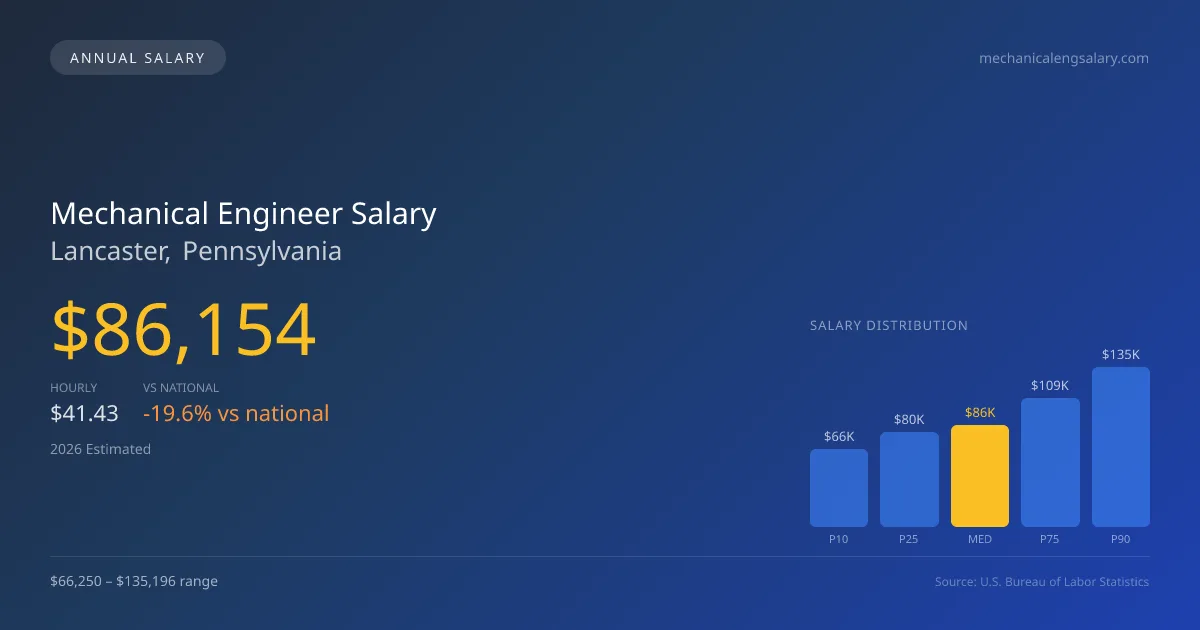
In 2026, the mechanical engineer salary in Lancaster, Pennsylvania, is projected to reach a median of $86,154, with a full salary range from $66,250 at the 10th percentile to $135,196 at the 90th percentile. This local figure, derived from the Bureau of Labor Statistics (BLS) Occupational Employment and Wage Statistics (OEWS) data, indicates a salary level that is significantly lower—approximately 19.59%—than the national median of $107,150. As mechanical engineers in Lancaster, particularly those specializing in HVAC and building systems, pursue their Professional Engineer (PE) licenses, they can expect upward mobility in their salaries, further enhancing their earning potential and job security. The local job market, with its diverse industrial focus, presents a range of employment opportunities for engineers, underscoring the value of specialized certifications and skills.
Salary Breakdown
| Percentile | Annual | Hourly |
|---|---|---|
| Entry Level (P10) | $66,250 | $31.85 |
| Lower Range (P25) | $80,319 | $38.62 |
| Median (P50)(typical) | $86,154 | $41.43 |
| Upper Range (P75) | $109,188 | $52.49 |
| Top Earners (P90) | $135,196 | $64.99 |
Median Salary Position
19.59% below the national average
2026 Salary Percentile Distribution in Lancaster
In Lancaster, PA, the mechanical engineer salary spread from the 10th to 90th percentile is $68,946 (2026 est.). At $86,154, the local median is 19.59% below the national median of $107,150.
Salary Calculator
At 40 hours/week in Lancaster: You'd be in the lower-middle range
How Lancaster Mechanical Engineer Pay Compares
Lancaster median: $86,154/year (2026)
| Compared To | Median Salary | Lancaster Pays |
|---|---|---|
| Pennsylvania Average | $96,912 | -11.10% less |
| National Average | $107,150 | -19.59% less |
Mechanical Engineers in Lancaster, PA earn a median of $86,154 per year (2026 est.), which is 19.59% lower than the national median of $107,150 and 11.10% below the Pennsylvania state average of $96,912.
Cost-of-Living Adjusted Salary
Lancaster has a cost of living 1.74% below the national average, meaning your salary goes further here.
Adjusted salary = nominal × (100 / CoL index). CoL index: 100 = national average.
Lancaster, PA has a cost-of-living index of 98.257 (below the national average of 100). A mechanical engineer earning $86,154 nominally has purchasing power equivalent to $87,682 in an average-cost city — an effective 1.77% boost.
Compare Purchasing Power
Select a city to see how your salary compares after cost of living
Select a city above to compare purchasing power
2019 BLS Actual
$79,050
2025 BLS Actual
$83,710
2026 Current Est.
$86,154
2019–2027 Growth
+12.2%
Salary Trajectory for Mechanical Engineers in Lancaster (2019–2027)
2019–2025: actual BLS OEWS data for this metro area. 2026+: CAGR 2.92% projection.
| Year | Annual Salary | Status |
|---|---|---|
| 2019 | $79,050 | Actual |
| 2020 | $78,580 | Actual |
| 2021 | $79,400 | Actual |
| 2022 | $80,440 | Actual |
| 2023 | $80,760 | Actual |
| 2024 | $84,970 | Actual |
| 2025 | $83,710 | Actual |
| 2026(current) | $86,154 | Estimated |
| 2027 | $88,670 | Projected |
Based on 7 years of BLS OEWS data for the Lancaster metropolitan area, the median mechanical engineer salary grew 5.9% from $79,050 (2019) to $83,710 (2025). At a 2.92% compound annual growth rate, salaries are projected to reach $88,670 by 2027 — a total increase of $9,620 (12.17%) from 2019.
Note: Historical values (2019–2025) are actual BLS OEWS figures for the Lancaster metropolitan area, sourced from annual Occupational Employment and Wage Statistics surveys. 2026–2026 figures are current estimates, and 2027 values are projections, calculated using a 2.92% CAGR derived from 7-year BLS historical data. Actual salaries may vary based on employer, experience, certifications, and local market conditions.
Salary by Experience Level
| Experience | Estimated Salary Range |
|---|---|
| 0-2 years (New Graduate) | $66,250 – $80,319 |
| 3-5 years (Mid Career) | $80,319 – $86,154 |
| 5+ years (Experienced) | $86,154 – $109,188 |
| 10+ years (Top Earner) | $109,188 – $135,196 |
ME, PE salary ranges estimated from BLS percentile data. Individual mechanical engineer compensation varies by employer, certifications, and specialization.
Mechanical Engineer Job Market in Lancaster
The job market in Lancaster PA employs around 560 mechanical engineers, and the area’s cost-of-living index, sitting at 98.257, suggests that the take-home purchasing power is more favorable than in many other regions. Major employers in the automotive sector, such as Tesla and Rivian, are reshaping pay scales, often offering higher compensation to attract talent in this competitive market. Industries like aerospace and defense, which include companies like Boeing and SpaceX, typically offer higher salary brackets due to the advanced skill sets and potential security clearances required. The variance in pay levels often correlates to the industry; aerospace and tech companies tend to offer more equity and bonuses than traditional manufacturing roles. Mechanical engineers looking to optimize their pay in Lancaster should consider gaining specialized PE licensure and seeking roles within burgeoning sectors like aerospace or high-demand areas such as HVAC to maximize their earning potential.
More salary data for Lancaster, PA:
Frequently Asked Questions
How much do mechanical engineers make in Lancaster, PA in 2026?
Is Lancaster, PA a good place to work as a mechanical engineer?
Can mechanical engineers make $100K in Lancaster?
What is the cost-of-living adjusted mechanical engineer salary in Lancaster?
How much does a mechanical engineer make per hour in Lancaster?
Related Pages
Compare Salaries
Career Resources
Nearby Cities in Pennsylvania
Written by Amina Patel, PE
Career Analyst
Amina has 10 years of experience in mechanical engineering. She specializes in thermal analysis and works in the automotive industry.
Methodology & Data Source
Salary figures on this page are 2026 projections based on the Bureau of Labor Statistics Occupational Employment and Wage Statistics (OEWS) survey, May 2026 release. The BLS reported a median annual salary of $83,710 for mechanical engineersin the Lancaster metropolitan area. A 2.92% compound annual growth rate (CAGR), calculated from 6-year national BLS wage trends, was applied to project current 2026 compensation. Percentile ranges (P10–P90) represent the full salary distribution across experience levels and practice settings in this market.
Data Sources & Methodology
Source: BLS, OEWS, 7-year dataset (–). Per-city data from annual BLS metropolitan area surveys.
2026 figures are projected from 2025 BLS data using a compound annual growth rate (CAGR) of 2.92%, derived from historical BLS wage trends for mechanical engineers (SOC 17-2141).
Compiled and verified by Amina Patel, PE, a licensed mechanical engineer with 10+ years of clinical experience. · View source data at BLS.gov