Mechanical Engineer Salary in Harlingen, TX: $107,214 (2026)
Quick Answer:A full-time mechanical engineer in Harlingen, TX earns a median $107,214/year (≈ $51.54/hour) in nominal terms for 2026 — projected from BLS OEWS 2025 (SOC 17-2141). Once you factor in Harlingen's price level (4% below national, BEA RPP 96.0), that paycheck buys what $111,681 would nationally. Nominal pay sits 3.9% above the Texas state average.
Based on BLS state-level estimates · View source
Mechanical engineers in Harlingen, TX can expect a median annual salary of $107,214 in 2026. This figure reflects a competitive standing overs compared to the national median of $107,150, highlighting the area's appeal for engineers. Salary ranges span from $75,352 at the lower end (P10) to $165,200 at the upper end (P90), offering various opportunities depending on experience and specialization. With local estimates derived from BLS state-level data, the remuneration in Harlingen is shaped by the presence of several dynamic industries, including aerospace with companies like SpaceX, and a growing automotive sector significantly driven by electric vehicle manufacturers.
About the Harlingen Market
Salary estimated from Texas average ($108,000) adjusted for local cost of living.
Salary Breakdown
| Percentile | Annual | Hourly |
|---|---|---|
| Entry Level (P10) | $75,352 | $36.23 |
| Lower Range (P25) | $89,288 | $42.93 |
| Median (P50)(typical) | $107,214 | $51.54 |
| Upper Range (P75) | $134,593 | $64.71 |
| Top Earners (P90) | $165,200 | $79.42 |
Median Salary Position
0.06% above the national average
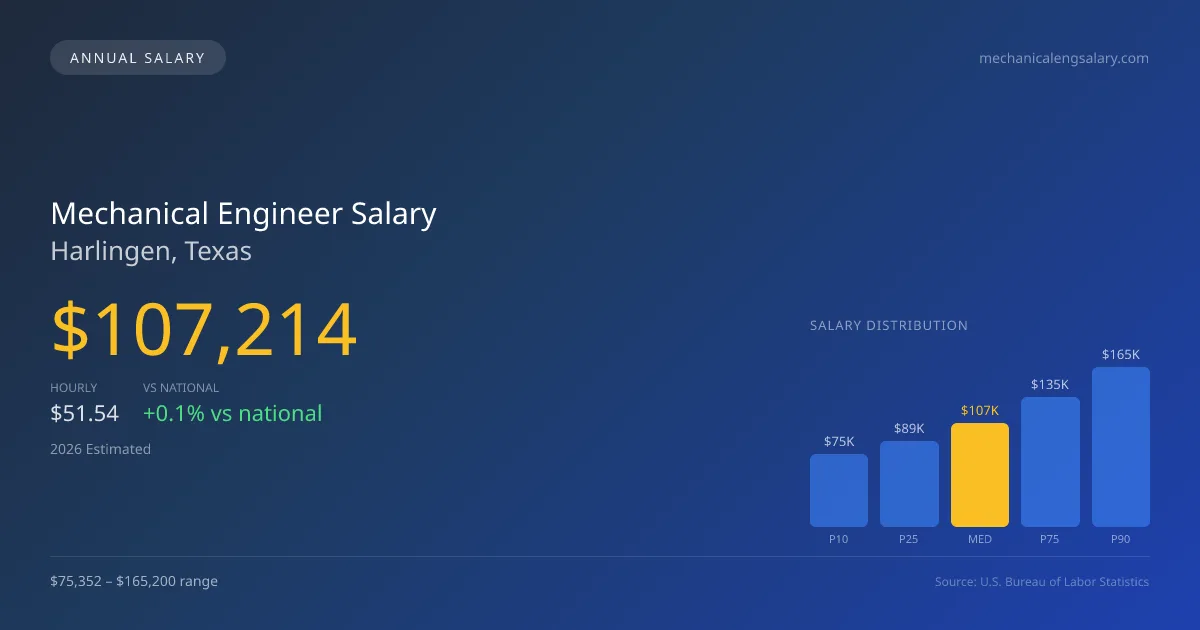
2026 Salary Percentile Distribution in Harlingen
In Harlingen, TX, the mechanical engineer salary spread from the 10th to 90th percentile is $89,848 (2026 est.). At $107,214, the local median is 0.06% above the national median of $107,150.
Salary Calculator
At 40 hours/week in Harlingen: You'd be in the lower-middle range
How Harlingen Mechanical Engineer Pay Compares
Harlingen median: $107,214/year (2026)
| Compared To | Median Salary | Harlingen Pays |
|---|---|---|
| Texas Average | $103,189 | +3.90% more |
| National Average | $107,150 | +0.06% more |
Mechanical Engineers in Harlingen, TX earn a median of $107,214 per year (2026 est.), which is 0.06% higher than the national median of $107,150 and 3.90% above the Texas state average of $103,189.
Cost-of-Living Adjusted Salary
Harlingen has a cost of living 4.00% below the national average, meaning your salary goes further here.
Adjusted salary = nominal × (100 / CoL index). CoL index: 100 = national average.
Harlingen, TX has a cost-of-living index of 96 (below the national average of 100). A mechanical engineer earning $107,214 nominally has purchasing power equivalent to $111,681 in an average-cost city — an effective 4.17% boost.
Compare Purchasing Power
Select a city to see how your salary compares after cost of living
Select a city above to compare purchasing power
2019 BLS Actual
$88,483
2025 BLS Actual
$104,172
2026 Current Est.
$107,214
2019–2027 Growth
+24.7%
Salary Trajectory for Mechanical Engineers in Harlingen (2019–2027)
2019–2025: actual BLS OEWS data for this metro area. 2026+: CAGR 2.92% projection.
| Year | Annual Salary | Status |
|---|---|---|
| 2019 | $88,483 | Actual |
| 2020 | $90,214 | Actual |
| 2021 | $95,357 | Actual |
| 2022 | $96,367 | Actual |
| 2023 | $99,569 | Actual |
| 2024 | $104,470 | Actual |
| 2025 | $104,172 | Actual |
| 2026(current) | $107,214 | Estimated |
| 2027 | $110,344 | Projected |
Based on 7 years of BLS OEWS data for the Harlingen metropolitan area, the median mechanical engineer salary grew 17.7% from $88,483 (2019) to $104,172 (2025). At a 2.92% compound annual growth rate, salaries are projected to reach $110,344 by 2027 — a total increase of $21,861 (24.71%) from 2019.
Note: Historical values (2019–2025) are actual BLS OEWS figures for the Harlingen metropolitan area, sourced from annual Occupational Employment and Wage Statistics surveys. 2026–2026 figures are current estimates, and 2027 values are projections, calculated using a 2.92% CAGR derived from 7-year BLS historical data. Actual salaries may vary based on employer, experience, certifications, and local market conditions.
Salary by Experience Level
| Experience | Estimated Salary Range |
|---|---|
| 0-2 years (New Graduate) | $75,352 – $89,288 |
| 3-5 years (Mid Career) | $89,288 – $107,214 |
| 5+ years (Experienced) | $107,214 – $134,593 |
| 10+ years (Top Earner) | $134,593 – $165,200 |
ME, PE salary ranges estimated from BLS percentile data. Individual mechanical engineer compensation varies by employer, certifications, and specialization.
Mechanical Engineer Job Market in Harlingen
Employment prospects for mechanical engineers in Harlingen are bolstered by a tight job market, with just 14 engineers currently employed in the area. The cost of living index sits at 96, indicating a slightly lower-than-average cost environment that enhances take-home pay and purchasing power. Among key employers, aerospace firms like SpaceX often lead the way in compensation, especially for engineers holding security clearances. In contrast, those within automotive and EV fields like Tesla may find varying pay scales. The differences in compensation frequently reflect industry demands, professional engineering licensure, and company equity packages. For aspiring engineers looking to maximize their salaries in Harlingen, focusing on high-demand sectors and pursuing additional certifications or clearances can significantly enhance earning potential.
More salary data for Harlingen, TX:
Frequently Asked Questions
How much do mechanical engineers make in Harlingen, TX in 2026?
Is Harlingen, TX a good place to work as a mechanical engineer?
Can mechanical engineers make $100K in Harlingen?
What is the cost-of-living adjusted mechanical engineer salary in Harlingen?
How much does a mechanical engineer make per hour in Harlingen?
Related Pages
Compare Salaries
Career Resources
Nearby Cities in Texas
Written by Amina Patel, PE
Career Analyst
Amina has 10 years of experience in mechanical engineering. She specializes in thermal analysis and works in the automotive industry.
Methodology & Data Source
Salary figures on this page are 2026 projections based on the Bureau of Labor Statistics Occupational Employment and Wage Statistics (OEWS) survey, May 2026 release. The BLS reported a median annual salary of $104,172 for mechanical engineersin the Harlingen metropolitan area. A 2.92% compound annual growth rate (CAGR), calculated from 6-year national BLS wage trends, was applied to project current 2026 compensation. Percentile ranges (P10–P90) represent the full salary distribution across experience levels and practice settings in this market.
Data Sources & Methodology
Salary data for Harlingen is estimated from official BLS state-level occupational wage data (2025), adjusted for regional cost-of-living differences using BEA RPP (Regional Price Parities).
2026 figures are projected from 2025 BLS data using a compound annual growth rate (CAGR) of 2.92%, derived from historical BLS wage trends for mechanical engineers (SOC 17-2141).
Compiled and verified by Amina Patel, PE, a licensed mechanical engineer with 10+ years of clinical experience. · View source data at BLS.gov