Mechanical Engineer Salary in Rutland, VT: $102,775 (2026)
Quick Answer:A full-time mechanical engineer in Rutland, VT earns a median $102,775/year (≈ $49.41/hour) in nominal terms for 2026 — projected from BLS OEWS 2025 (SOC 17-2141). Once you factor in Rutland's price level (4% above national, BEA RPP 103.5), that paycheck buys what $99,300 would nationally. Nominal pay sits 7.3% below the Vermont state average.
Based on BLS state-level estimates · View source
Mechanical engineers in Rutland, Vermont, can expect a median annual salary of $102,775 in 2026, which positions them slightly below the national median of $107,150. The local salary range spans from $80,006 at the 10th percentile to $152,351 at the 90th percentile, reflecting a competitive yet varied market for engineering roles. These figures are based on estimates derived from 2025 BLS data, adjusted for regional cost factors. For mechanical engineers specializing in HVAC and building systems, obtaining a Professional Engineer (PE) license can further elevate earning potential, which is essential in a market where such credentials are particularly valued. Rutland's job market offers a distinct opportunity for engineers, whether they are just entering the field or are seasoned professionals.
About the Rutland Market
Salary estimated from Vermont average ($92,000) adjusted for local cost of living.
Salary Breakdown
| Percentile | Annual | Hourly |
|---|---|---|
| Entry Level (P10) | $80,006 | $38.46 |
| Lower Range (P25) | $86,541 | $41.61 |
| Median (P50)(typical) | $102,775 | $49.41 |
| Upper Range (P75) | $127,251 | $61.18 |
| Top Earners (P90) | $152,351 | $73.25 |
Median Salary Position
4.08% below the national average
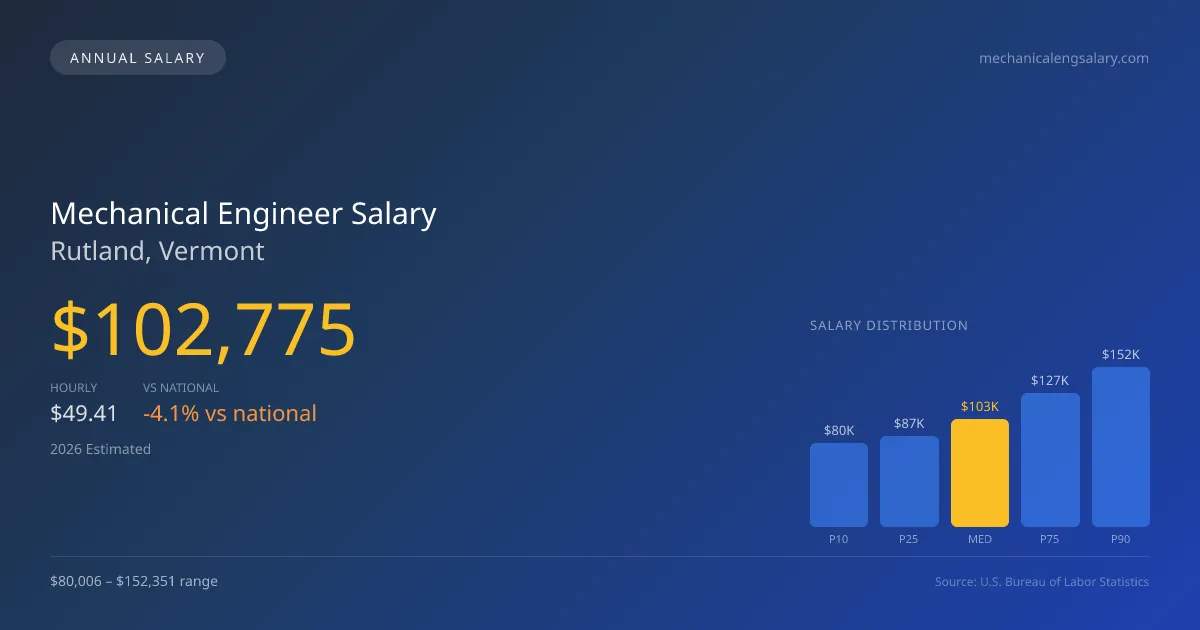
2026 Salary Percentile Distribution in Rutland
In Rutland, VT, the mechanical engineer salary spread from the 10th to 90th percentile is $72,345 (2026 est.). At $102,775, the local median is 4.08% below the national median of $107,150.
Salary Calculator
At 40 hours/week in Rutland: You'd be in the lower-middle range
How Rutland Mechanical Engineer Pay Compares
Rutland median: $102,775/year (2026)
| Compared To | Median Salary | Rutland Pays |
|---|---|---|
| Vermont Average | $110,868 | -7.30% less |
| National Average | $107,150 | -4.08% less |
Mechanical Engineers in Rutland, VT earn a median of $102,775 per year (2026 est.), which is 4.08% lower than the national median of $107,150 and 7.30% below the Vermont state average of $110,868.
Cost-of-Living Adjusted Salary
Rutland has a cost of living 3.50% above the national average.
Adjusted salary = nominal × (100 / CoL index). CoL index: 100 = national average.
Rutland, VT has a cost-of-living index of 103.5 (above the national average of 100). While the nominal salary of $102,775 is competitive, the higher cost of living reduces purchasing power to an effective $99,300 — a 3.38% reduction.
Compare Purchasing Power
Select a city to see how your salary compares after cost of living
Select a city above to compare purchasing power
2019 BLS Actual
$84,819
2025 BLS Actual
$99,859
2026 Current Est.
$102,775
2019–2027 Growth
+24.7%
Salary Trajectory for Mechanical Engineers in Rutland (2019–2027)
2019–2025: actual BLS OEWS data for this metro area. 2026+: CAGR 2.92% projection.
| Year | Annual Salary | Status |
|---|---|---|
| 2019 | $84,819 | Actual |
| 2020 | $86,479 | Actual |
| 2021 | $91,409 | Actual |
| 2022 | $92,377 | Actual |
| 2023 | $95,447 | Actual |
| 2024 | $88,243 | Actual |
| 2025 | $99,859 | Actual |
| 2026(current) | $102,775 | Estimated |
| 2027 | $105,776 | Projected |
Based on 7 years of BLS OEWS data for the Rutland metropolitan area, the median mechanical engineer salary grew 17.7% from $84,819 (2019) to $99,859 (2025). At a 2.92% compound annual growth rate, salaries are projected to reach $105,776 by 2027 — a total increase of $20,957 (24.71%) from 2019.
Note: Historical values (2019–2025) are actual BLS OEWS figures for the Rutland metropolitan area, sourced from annual Occupational Employment and Wage Statistics surveys. 2026–2026 figures are current estimates, and 2027 values are projections, calculated using a 2.92% CAGR derived from 7-year BLS historical data. Actual salaries may vary based on employer, experience, certifications, and local market conditions.
Salary by Experience Level
| Experience | Estimated Salary Range |
|---|---|
| 0-2 years (New Graduate) | $80,006 – $86,541 |
| 3-5 years (Mid Career) | $86,541 – $102,775 |
| 5+ years (Experienced) | $102,775 – $127,251 |
| 10+ years (Top Earner) | $127,251 – $152,351 |
ME, PE salary ranges estimated from BLS percentile data. Individual mechanical engineer compensation varies by employer, certifications, and specialization.
Mechanical Engineer Job Market in Rutland
In Rutland, the mechanical engineering job market is currently quite limited, with only four engineers employed in the area. While this presents a small community of professionals, it also signifies a tight-knit network where connections can lead to opportunities. With a cost of living index of 103.5, engineers in Rutland may find their take-home pay stretched slightly, but the local demand for various engineering disciplines offers room for negotiation on salaries. Major employers that pay competitively include those involved in automotive innovation and HVAC firms. The difference between high and low salaries often hinges on industry sector, with aerospace and defense firms, like SpaceX, typically offering premium salaries due to advanced technologies and security clearances. To maximize mechanical engineer pay in Rutland, professionals should consider pursuing specialized roles that require PE licensure, while also staying informed about local industry trends that can influence compensation dramatically.
More salary data for Rutland, VT:
Frequently Asked Questions
How much do mechanical engineers make in Rutland, VT in 2026?
Is Rutland, VT a good place to work as a mechanical engineer?
Can mechanical engineers make $100K in Rutland?
What is the cost-of-living adjusted mechanical engineer salary in Rutland?
How much does a mechanical engineer make per hour in Rutland?
Related Pages
Compare Salaries
Career Resources
Nearby Cities in Vermont
Written by Amina Patel, PE
Career Analyst
Amina has 10 years of experience in mechanical engineering. She specializes in thermal analysis and works in the automotive industry.
Methodology & Data Source
Salary figures on this page are 2026 projections based on the Bureau of Labor Statistics Occupational Employment and Wage Statistics (OEWS) survey, May 2026 release. The BLS reported a median annual salary of $99,859 for mechanical engineersin the Rutland metropolitan area. A 2.92% compound annual growth rate (CAGR), calculated from 6-year national BLS wage trends, was applied to project current 2026 compensation. Percentile ranges (P10–P90) represent the full salary distribution across experience levels and practice settings in this market.
Data Sources & Methodology
Salary data for Rutland is estimated from official BLS state-level occupational wage data (2025), adjusted for regional cost-of-living differences using BEA RPP (Regional Price Parities).
2026 figures are projected from 2025 BLS data using a compound annual growth rate (CAGR) of 2.92%, derived from historical BLS wage trends for mechanical engineers (SOC 17-2141).
Compiled and verified by Amina Patel, PE, a licensed mechanical engineer with 10+ years of clinical experience. · View source data at BLS.gov