Mechanical Engineer Salary in Winchester, VA: $103,311 (2026)
Quick Answer:A full-time mechanical engineer in Winchester, VA earns a median $103,311/year (≈ $49.67/hour) in nominal terms for 2026 — projected from BLS OEWS 2025 (SOC 17-2141). Once you factor in Winchester's price level (4% below national, BEA RPP 96.5), that paycheck buys what $107,114 would nationally. Nominal pay sits 0.0% above the Virginia state average.
Official BLS data · View source
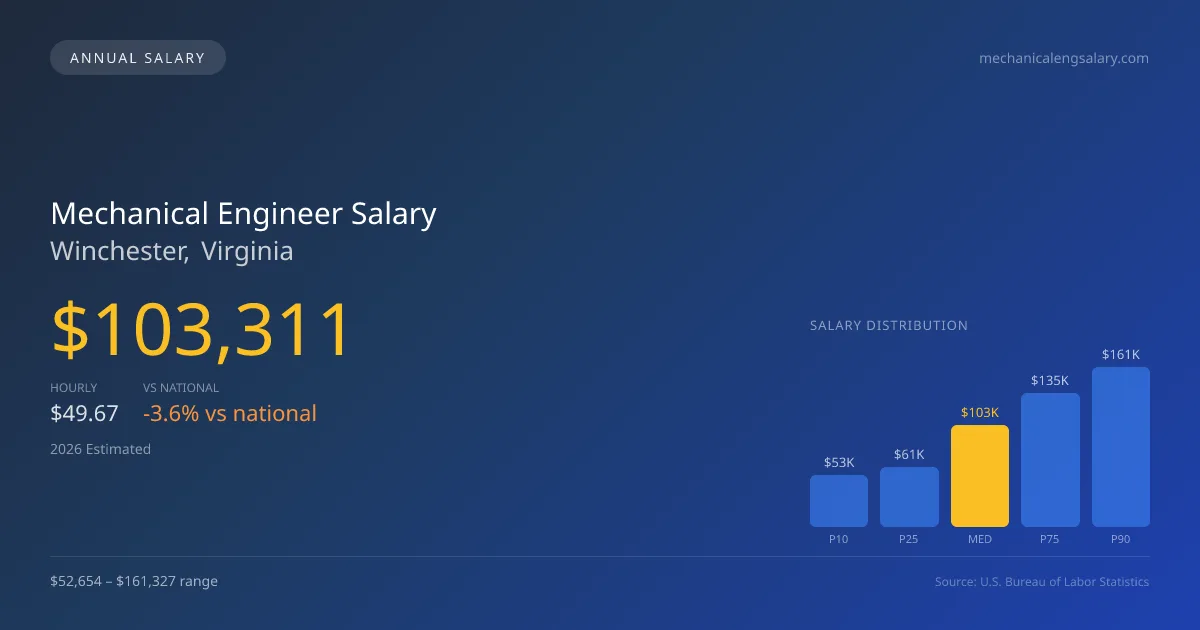
In 2026, mechanical engineers in Winchester, Virginia, can anticipate a median annual salary of $103,311, reflecting a slight decrease of 3.58% compared to the national median of $107,150. The salary range for these professionals spans from $52,654 at the 10th percentile to as high as $161,327 at the 90th percentile. This data, derived from the official Bureau of Labor Statistics (BLS) OEWS surveys, indicates that while Winchester's compensation is competitive at certain levels, it aligns somewhat lower than the national average. With factors such as equity compensation becoming increasingly relevant in the industry, particularly at innovative companies like SpaceX and Tesla, the dynamics of total earnings, including stock options, can significantly influence overall compensation packages for mechanical engineers in this locale.
Salary Breakdown
| Percentile | Annual | Hourly |
|---|---|---|
| Entry Level (P10) | $52,654 | $25.31 |
| Lower Range (P25) | $60,774 | $29.22 |
| Median (P50)(typical) | $103,311 | $49.67 |
| Upper Range (P75) | $135,463 | $65.13 |
| Top Earners (P90) | $161,327 | $77.56 |
Median Salary Position
3.58% below the national average
2026 Salary Percentile Distribution in Winchester
In Winchester, VA, the mechanical engineer salary spread from the 10th to 90th percentile is $108,673 (2026 est.). At $103,311, the local median is 3.58% below the national median of $107,150.
Salary Calculator
At 40 hours/week in Winchester: You'd be in the lower-middle range
How Winchester Mechanical Engineer Pay Compares
Winchester median: $103,311/year (2026)
| Compared To | Median Salary | Winchester Pays |
|---|---|---|
| National Average | $107,150 | -3.58% less |
Mechanical Engineers in Winchester, VA earn a median of $103,311 per year (2026 est.), which is 3.58% lower than the national median of $107,150.
Cost-of-Living Adjusted Salary
Winchester has a cost of living 3.55% below the national average, meaning your salary goes further here.
Adjusted salary = nominal × (100 / CoL index). CoL index: 100 = national average.
Winchester, VA has a cost-of-living index of 96.45 (below the national average of 100). A mechanical engineer earning $103,311 nominally has purchasing power equivalent to $107,114 in an average-cost city — an effective 3.68% boost.
Compare Purchasing Power
Select a city to see how your salary compares after cost of living
Select a city above to compare purchasing power
2019 BLS Actual
$112,910
2025 BLS Actual
$100,380
2026 Current Est.
$103,311
2019–2027 Growth
+-5.8%
Salary Trajectory for Mechanical Engineers in Winchester (2019–2027)
2019–2025: actual BLS OEWS data for this metro area. 2026+: CAGR 2.92% projection.
| Year | Annual Salary | Status |
|---|---|---|
| 2019 | $112,910 | Actual |
| 2020 | $88,680 | Actual |
| 2021 | $79,640 | Actual |
| 2022 | $84,500 | Actual |
| 2023 | $78,470 | Actual |
| 2024 | $89,360 | Actual |
| 2025 | $100,380 | Actual |
| 2026(current) | $103,311 | Estimated |
| 2027 | $106,328 | Projected |
Based on 7 years of BLS OEWS data for the Winchester metropolitan area, the median mechanical engineer salary grew -11.1% from $112,910 (2019) to $100,380 (2025). At a 2.92% compound annual growth rate, salaries are projected to reach $106,328 by 2027 — a total increase of $-6,582 (-5.83%) from 2019.
Note: Historical values (2019–2025) are actual BLS OEWS figures for the Winchester metropolitan area, sourced from annual Occupational Employment and Wage Statistics surveys. 2026–2026 figures are current estimates, and 2027 values are projections, calculated using a 2.92% CAGR derived from 7-year BLS historical data. Actual salaries may vary based on employer, experience, certifications, and local market conditions.
Salary by Experience Level
| Experience | Estimated Salary Range |
|---|---|
| 0-2 years (New Graduate) | $52,654 – $60,774 |
| 3-5 years (Mid Career) | $60,774 – $103,311 |
| 5+ years (Experienced) | $103,311 – $135,463 |
| 10+ years (Top Earner) | $135,463 – $161,327 |
ME, PE salary ranges estimated from BLS percentile data. Individual mechanical engineer compensation varies by employer, certifications, and specialization.
Mechanical Engineer Job Market in Winchester
The local job market for mechanical engineers is relatively small, employing just 40 professionals in the area. This limited number may create a competitive environment for job seekers, with organizations such as Lockheed Martin or Boeing actively attracting talent, often offering higher salaries to those with specialized skills or security clearances. Given Winchester's cost-of-living index of 96.45, below the national average, the purchasing power of salaries here is relatively favorable, making it an attractive location for engineers who prioritize quality of life alongside compensation. Employers focused on aerospace and defense, as well as HVAC and heavy equipment manufacturing, generally offer more competitive pay scales. Mechanical engineers should consider pathways to enhance their earnings, such as obtaining a Professional Engineer (PE) license or pursuing management roles, which can yield higher compensation, particularly in demand sectors.
More salary data for Winchester, VA:
Frequently Asked Questions
How much do mechanical engineers make in Winchester, VA in 2026?
Is Winchester, VA a good place to work as a mechanical engineer?
Can mechanical engineers make $100K in Winchester?
What is the cost-of-living adjusted mechanical engineer salary in Winchester?
How much does a mechanical engineer make per hour in Winchester?
Related Pages
Compare Salaries
Career Resources
Nearby Cities in Virginia
Written by Amina Patel, PE
Career Analyst
Amina has 10 years of experience in mechanical engineering. She specializes in thermal analysis and works in the automotive industry.
Methodology & Data Source
Salary figures on this page are 2026 projections based on the Bureau of Labor Statistics Occupational Employment and Wage Statistics (OEWS) survey, May 2026 release. The BLS reported a median annual salary of $100,380 for mechanical engineersin the Winchester metropolitan area. A 2.92% compound annual growth rate (CAGR), calculated from 6-year national BLS wage trends, was applied to project current 2026 compensation. Percentile ranges (P10–P90) represent the full salary distribution across experience levels and practice settings in this market.
Data Sources & Methodology
Source: BLS, OEWS, 7-year dataset (–). Per-city data from annual BLS metropolitan area surveys.
2026 figures are projected from 2025 BLS data using a compound annual growth rate (CAGR) of 2.92%, derived from historical BLS wage trends for mechanical engineers (SOC 17-2141).
Compiled and verified by Amina Patel, PE, a licensed mechanical engineer with 10+ years of clinical experience. · View source data at BLS.gov