Mechanical Engineer Salary in Shoreline, WA: $111,021 (2026)
Quick Answer:A full-time mechanical engineer in Shoreline, WA earns a median $111,021/year (≈ $53.37/hour) in nominal terms for 2026 — projected from BLS OEWS 2025 (SOC 17-2141). Once you factor in Shoreline's price level (7% above national, BEA RPP 107.4), that paycheck buys what $103,372 would nationally. Nominal pay sits 0.3% above the Washington state average.
Based on BLS state-level estimates · View source
Mechanical engineers in Shoreline, Washington, can expect a median annual salary of $111,021 in 2026, positioning them slightly above the national median of $107,150. The salary range here varies significantly, with entry-level positions starting at approximately $77,203 and more experienced roles reaching up to $172,082. These figures are locally estimated from BLS state-level data, taking into account the regional cost of living adjustments and industry demand. The local job market reflects a strong engineering presence primarily driven by industries such as aerospace and HVAC, offering mechanical engineers opportunities at prominent companies like SpaceX and Boeing, which influence the competitive pay structure in the area.
About the Shoreline Market
Salary estimated from Washington average ($118,000) adjusted for local cost of living.
Salary Breakdown
| Percentile | Annual | Hourly |
|---|---|---|
| Entry Level (P10) | $77,203 | $37.11 |
| Lower Range (P25) | $87,610 | $42.11 |
| Median (P50)(typical) | $111,021 | $53.37 |
| Upper Range (P75) | $141,184 | $67.88 |
| Top Earners (P90) | $172,082 | $82.73 |
Median Salary Position
3.61% above the national average
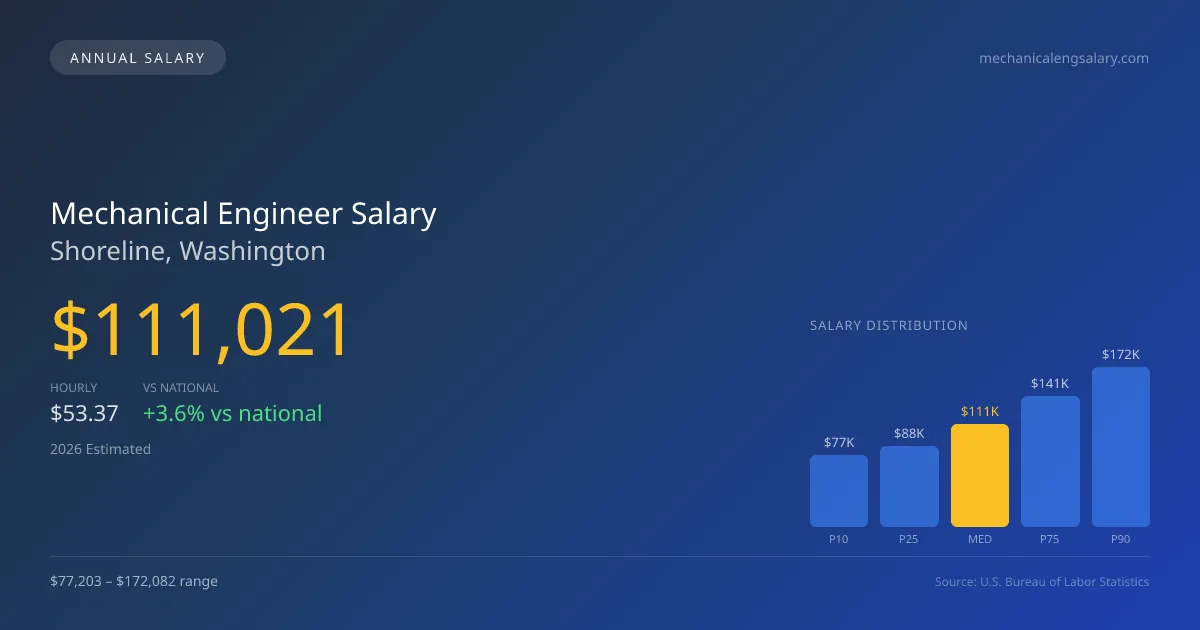
2026 Salary Percentile Distribution in Shoreline
In Shoreline, WA, the mechanical engineer salary spread from the 10th to 90th percentile is $94,879 (2026 est.). At $111,021, the local median is 3.61% above the national median of $107,150.
Salary Calculator
At 40 hours/week in Shoreline: You'd be in the lower-middle range
How Shoreline Mechanical Engineer Pay Compares
Shoreline median: $111,021/year (2026)
| Compared To | Median Salary | Shoreline Pays |
|---|---|---|
| Washington Average | $110,689 | +0.30% more |
| National Average | $107,150 | +3.61% more |
Mechanical Engineers in Shoreline, WA earn a median of $111,021 per year (2026 est.), which is 3.61% higher than the national median of $107,150 and 0.30% above the Washington state average of $110,689.
Cost-of-Living Adjusted Salary
Shoreline has a cost of living 7.40% above the national average.
Adjusted salary = nominal × (100 / CoL index). CoL index: 100 = national average.
Shoreline, WA has a cost-of-living index of 107.4 (above the national average of 100). While the nominal salary of $111,021 is competitive, the higher cost of living reduces purchasing power to an effective $103,372 — a 6.89% reduction.
Compare Purchasing Power
Select a city to see how your salary compares after cost of living
Select a city above to compare purchasing power
2019 BLS Actual
$91,625
2025 BLS Actual
$107,871
2026 Current Est.
$111,021
2019–2027 Growth
+24.7%
Salary Trajectory for Mechanical Engineers in Shoreline (2019–2027)
2019–2025: actual BLS OEWS data for this metro area. 2026+: CAGR 2.92% projection.
| Year | Annual Salary | Status |
|---|---|---|
| 2019 | $91,625 | Actual |
| 2020 | $93,417 | Actual |
| 2021 | $98,743 | Actual |
| 2022 | $99,789 | Actual |
| 2023 | $103,105 | Actual |
| 2024 | $127,116 | Actual |
| 2025 | $107,871 | Actual |
| 2026(current) | $111,021 | Estimated |
| 2027 | $114,263 | Projected |
Based on 7 years of BLS OEWS data for the Shoreline metropolitan area, the median mechanical engineer salary grew 17.7% from $91,625 (2019) to $107,871 (2025). At a 2.92% compound annual growth rate, salaries are projected to reach $114,263 by 2027 — a total increase of $22,638 (24.71%) from 2019.
Note: Historical values (2019–2025) are actual BLS OEWS figures for the Shoreline metropolitan area, sourced from annual Occupational Employment and Wage Statistics surveys. 2026–2026 figures are current estimates, and 2027 values are projections, calculated using a 2.92% CAGR derived from 7-year BLS historical data. Actual salaries may vary based on employer, experience, certifications, and local market conditions.
Salary by Experience Level
| Experience | Estimated Salary Range |
|---|---|
| 0-2 years (New Graduate) | $77,203 – $87,610 |
| 3-5 years (Mid Career) | $87,610 – $111,021 |
| 5+ years (Experienced) | $111,021 – $141,184 |
| 10+ years (Top Earner) | $141,184 – $172,082 |
ME, PE salary ranges estimated from BLS percentile data. Individual mechanical engineer compensation varies by employer, certifications, and specialization.
Mechanical Engineer Job Market in Shoreline
Among the eight mechanical engineers employed in Shoreline, the local cost of living index is at 107.4, indicating slightly above-average living expenses compared to national averages. This reality affects take-home pay, necessitating higher salaries to maintain a robust quality of life. Employers from the aerospace sector, particularly those like SpaceX and Boeing, generally offer the highest compensation, closely followed by automotive firms such as Tesla, which have surged in salary offerings. Factors contributing to the broad salary range include industry diversity, opportunities for obtaining a PE license, and the potential for security clearance in defense roles. To maximize earning potential in Shoreline's market, engineers should consider specializing in industries with the highest demand, pursuing advanced certifications, and exploring management tracks that often provide increased financial rewards.
More salary data for Shoreline, WA:
Frequently Asked Questions
How much do mechanical engineers make in Shoreline, WA in 2026?
Is Shoreline, WA a good place to work as a mechanical engineer?
Can mechanical engineers make $100K in Shoreline?
What is the cost-of-living adjusted mechanical engineer salary in Shoreline?
How much does a mechanical engineer make per hour in Shoreline?
Related Pages
Compare Salaries
Career Resources
Nearby Cities in Washington
Written by Amina Patel, PE
Career Analyst
Amina has 10 years of experience in mechanical engineering. She specializes in thermal analysis and works in the automotive industry.
Methodology & Data Source
Salary figures on this page are 2026 projections based on the Bureau of Labor Statistics Occupational Employment and Wage Statistics (OEWS) survey, May 2026 release. The BLS reported a median annual salary of $107,871 for mechanical engineersin the Shoreline metropolitan area. A 2.92% compound annual growth rate (CAGR), calculated from 6-year national BLS wage trends, was applied to project current 2026 compensation. Percentile ranges (P10–P90) represent the full salary distribution across experience levels and practice settings in this market.
Data Sources & Methodology
Salary data for Shoreline is estimated from official BLS state-level occupational wage data (2025), adjusted for regional cost-of-living differences using BEA RPP (Regional Price Parities).
2026 figures are projected from 2025 BLS data using a compound annual growth rate (CAGR) of 2.92%, derived from historical BLS wage trends for mechanical engineers (SOC 17-2141).
Compiled and verified by Amina Patel, PE, a licensed mechanical engineer with 10+ years of clinical experience. · View source data at BLS.gov